Installing GoAccess (A Real-time web log analyzer)
Last updated on July 27, 2020
GoAccess is an open source software which allows us to monitor a web server in real time. It displays the statistics after reading web server logs. The purpose behind the GoAccess was to provide valuable information to the site administrator in real-time right inside the terminal. GoAccess is not just limited to the terminal, it also gives you the option to view statistics in the browser.
Here are some of the features of GoAccess:
- Real-Time Analytics in terminal and browser.
- Determines visitors, hits, bandwidth, 404 errors, geolocation and much more.
- Beautiful colored dashboards.
- Supports nearly all Web log formats.
- It works right out of the box without any configuration.
- It is written in C so it is quite fast.
- Small footprint.
- It is cross-platform.
Note: It is important to note that GoAccess is not a drop-in replacement for Google Analytics, though some features overlap.
This post first shows how to install GoAccess on your server and then goes on to explain various ways to use GoAccess.
Let's get started.
Installing GoAccess #
To install GoAccess on Debian based distributions like Ubuntu use the following command:
1 2 3 4 | $ echo "deb http://deb.goaccess.io/ $(lsb_release -cs) main" | sudo tee -a /etc/apt/sources.list.d/goaccess.list
$ wget -O - https://deb.goaccess.io/gnugpg.key | sudo apt-key add -
$ sudo apt-get update
$ sudo apt-get install goaccess
|
Red Hat/Fedora/CentOS users can use this command:
$ yum install goaccess
Mac OS users can install GoAccess using the brew package manager.
$ brew install goaccess
GoAccess can also be installed on Windows through Cygwin. First Download the Cygwin from this link. In the package installation screen select the following packages:
| Package | Description |
|---|---|
| libGeoIP-devel | GeoIP2 C library |
| libncurses-devel | Terminal display library |
| libncursesw10 | Terminal display library (wide-character) |
| gcc-core (C) | GNU Compiler Collection |
| make | make utility |
| automake | GNU Makefiles |
| gettext | GNU Gettext |
| automake wrapper scripts | wrapper scripts for automake and aclocals |
Next, download GoAccess from here and move it to C:\cygwin64 directory. Start the Cygwin shell and run the following commands to install GoAccess:
1 2 3 4 5 | tar -xzvf goaccess-1.2.tar.gz
$ cd goaccess-1.2/
$ ./configure --enable-utf8 --enable-geoip=legacy
$ make
$ make install
|
Running GoAccess #
To use GoAccess you first need to determine the format of the web log. Servers use different log formats. The following table lists some common server, their default web log format and the corresponding log format name defined by the GoAccess.
| Server/Service | Log Format | Log Format name in GoAccess |
|---|---|---|
| Nginx | NCSA Combined Log Format | COMBINED |
| Apache | Common Log Format | COMMON |
| IIS | W3C Extended | W3C |
| Google Cloud Storage | Custom | CLOUDSTORAGE |
| Elastic Load Balancing (AWS) | Custom | AWSELB |
| Amazon Simple Storage Service (S3) | Custom | AWSS3 |
We now know different formats used by the server logs. Let's analyze some web logs. The most basic way to use GoAccess is as follows:
$ goaccess /path/to/server.log -c
This command first prompts you to select the log format and then displays the statistics in real time.
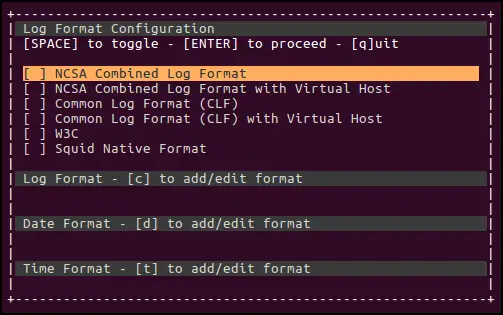
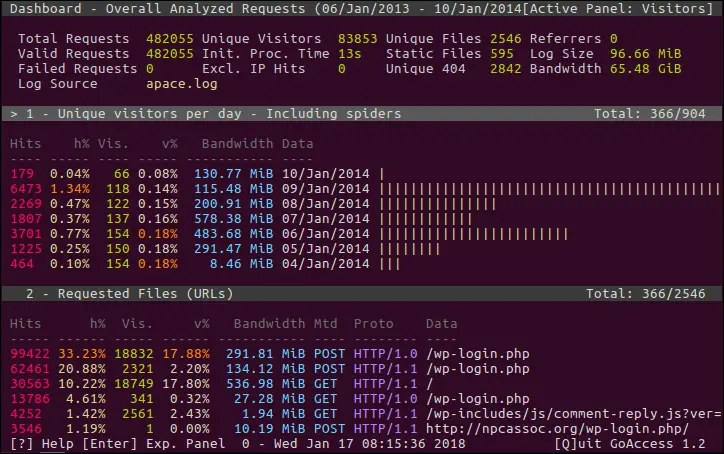
Once you are inside GoAccess dashboard you can use arrow keys to navigate around it. To quit the program hit the q key.
You can also specify the log format using --log-format option as follows:
$ goaccess /var/log/nginx/access.log --log-format=COMBINED
To create an HTML report from web log use the following command:
$ goaccess /var/log/nginx/access.log --log-format=COMBINED -o report.html
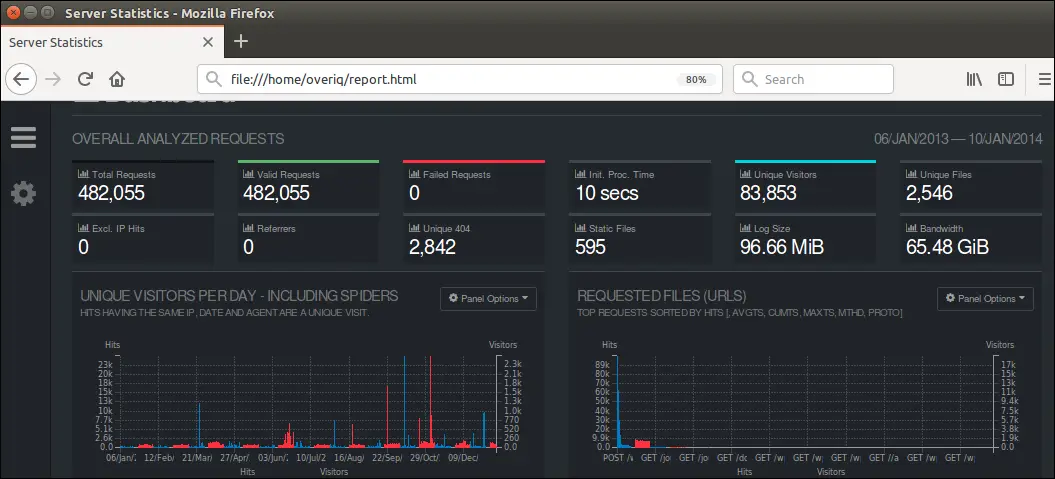
The report generated by this command is static. To generate real-time report type the following command:
$ goaccess /var/log/nginx/access.log --log-format=COMBINED -o realtime-report.html --real-time-html
If the situation demands, you can create JSON and CSV reports too.
1 2 | $ goaccess /var/log/nginx/access.log --log-format=COMBINED -o json report.html # outputs a JSON report
$ goaccess /var/log/nginx/access.log --log-format=COMBINED -o csv report.html # outputs a CSV report
|
GoAccess Modules #
GoAccess dashboard is divided into various panels. You can use the tab key to iterate through the panels. The top right corner of the terminal shows the currently selected terminal.
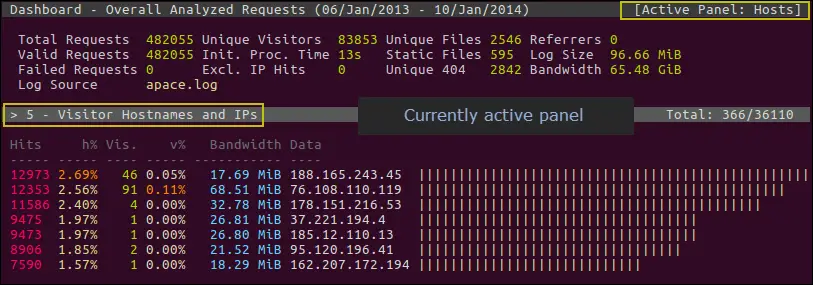
To drill down into the details of the selected panel hit the Enter key.
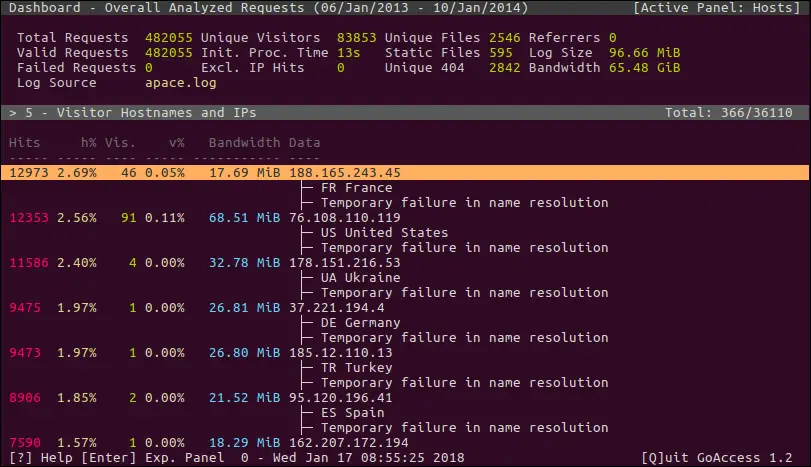
At any point, you can hit Shift+Q to open quick help screen.
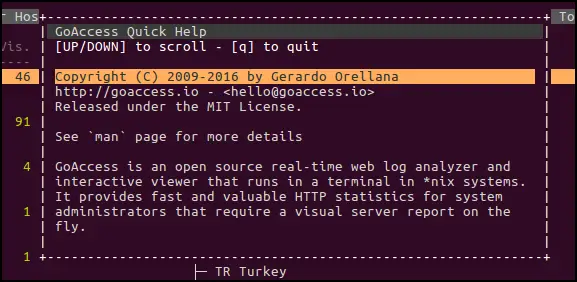
To close the helps screen hit q.
You should now feel comfortable navigating around GoAccess. The following is a rundown of various panels inside the GoAccess dashboard.
General Statistics: #
At the top of the dashboard, GoAccess displays general statistics like Total requests, Unique visitors, referrals, bandwidth etc.
Unique Visitors: #
This panel displays top unique visitors along with hits and cumulative bandwidth. A request is considered unique if its IP, date and user agent are same.
Requested Files: #
This panel displays top requested files on the server.
Static Requests: #
This panel displays top static requests. The static request refers to the request which requests a static asset like images, CSS, JS etc.
Not Found URLs (404s): #
This panel displays top URLs which returned 404.
Visitor Hostnames and IPs: #
This panel shows top hostnames and IPs of the visitors.
Operating Systems: #
This panel shows top Operating Systems used by the visitors.
Browsers: #
This panel shows top browsers used by the visitors.
Time Distribution: #
This panel show hourly report.
Referring Sites: #
It shows top referral sites.
HTTP Status Codes: #
This panel shows top HTTP status code encountered by the server.
Geo Location: #
This panel shows the top geographical location of the site visitors.
Now you should know how to install and use GoAccess. Give it a try and let me know how it works for you?
Load Comments